Multi-List Comparison Tool: Compare Up to 10 Lists Simultaneously for Advanced Data Analysis
Discover our new multi-list comparison feature that lets you compare up to 10 lists at once. Perfect for social media managers, data analysts, and businesses who need to analyze complex relationships between multiple datasets.
Last month, I was helping a friend who runs a small marketing agency. She was drowning in spreadsheets, trying to compare follower lists from five different social media platforms for a client campaign. "There has to be a better way," she said, staring at her screen with tired eyes. That conversation sparked something in me—and today, I'm excited to share the solution we built together.
The Real Problem with Traditional List Comparison
Most of us have been there. You have multiple datasets—maybe customer lists from different quarters, follower lists from various platforms, or inventory data from multiple suppliers. The traditional approach? Open multiple tabs, create complex formulas, and spend hours trying to make sense of overlapping data.
But here's the thing: when you need to compare lists beyond just two datasets, existing tools fall short. Sure, you can compare two lists easily enough, but what happens when you need to analyze relationships between three, five, or even ten different lists? That's where our new multi-list comparison tool comes in.
Introducing Multi-List Comparison: A Game-Changer for Data Analysis
Our new multi-list comparison feature transforms how you analyze complex datasets. Instead of juggling multiple two-way comparisons, you can now compare lists from 3 to 10 different sources simultaneously, uncovering insights that would be impossible to spot otherwise.
Why Multi-List Comparison Matters
Think about it: in today's interconnected world, data rarely exists in isolation. A social media manager doesn't just want to compare two lists of followers—they need to understand the overlap between Instagram, Twitter, TikTok, and LinkedIn audiences. A retailer doesn't just want to diff lists from two suppliers—they need to analyze inventory across multiple vendors to optimize their supply chain.
When you compare lists across multiple datasets, you discover:
- Common elements across all lists: The core items that appear everywhere
- Unique elements per list: What makes each dataset special
- Partial overlaps: Items that appear in some lists but not others
- Statistical relationships: How similar or different your datasets really are
Real-World Applications That Matter
Social Media Management Made Simple
Remember my friend with the marketing agency? Here's how she uses our multi-list comparison tool now:
She uploads follower lists from Instagram, Twitter, Facebook, LinkedIn, and TikTok for each client. Within seconds, she can see:
- Which followers are engaged across all platforms (her client's super fans)
- Platform-specific audiences that might be worth targeting on other channels
- The overall reach when combining all platforms (accounting for overlaps)
"It's like having X-ray vision for social media," she told me last week. "I can spot opportunities and create targeted campaigns that I never would have thought of before."
E-commerce and Inventory Intelligence
One of our users, Sarah, manages inventory for a boutique clothing store. She sources from six different suppliers and was constantly struggling to avoid duplicate orders while ensuring she had comprehensive coverage.
Now she compares lists of available items from all suppliers simultaneously:
- Items available from all suppliers (she can negotiate better prices)
- Unique items from each supplier (exclusive pieces for her store)
- Seasonal overlap patterns (helping with buying decisions)
"I used to spend entire weekends with spreadsheets," Sarah shared. "Now I upload my supplier catalogs, hit compare, and have my buying strategy mapped out in minutes."
Data Analysis for Business Intelligence
Tech companies use our multi-list comparison for user behavior analysis. By comparing user lists from different features, time periods, or user segments, they can:
- Identify power users who engage with multiple features
- Spot feature adoption patterns
- Understand user journey overlaps
- Make data-driven product decisions
The Technology Behind the Magic
Smart Separator Detection (Just Like Our Main Tool)
We didn't reinvent the wheel—we made it better. Our multi-list comparison uses the same intelligent separator detection that makes our main comparison tool so reliable. Whether your data uses commas, semicolons, line breaks, or even Chinese punctuation marks, our system automatically figures it out.
This means you can compare lists from different sources without worrying about formatting inconsistencies. Upload a CSV from one platform, paste text from another, and drag in an Excel file from a third—our tool handles it all seamlessly.
Visual Results That Actually Make Sense
The results aren't just functional—they're beautiful and intuitive. Each list gets its own color, making it easy to track which items belong where. The statistics dashboard gives you the big picture at a glance, while the detailed breakdowns let you dive deep into the data.
Privacy-First Architecture
Just like our main tool, everything happens in your browser. Your data never touches our servers, never gets stored, and never gets shared. When you compare lists with sensitive information—customer data, financial records, proprietary research—you can do so with complete confidence.
Getting Started: It's Easier Than You Think
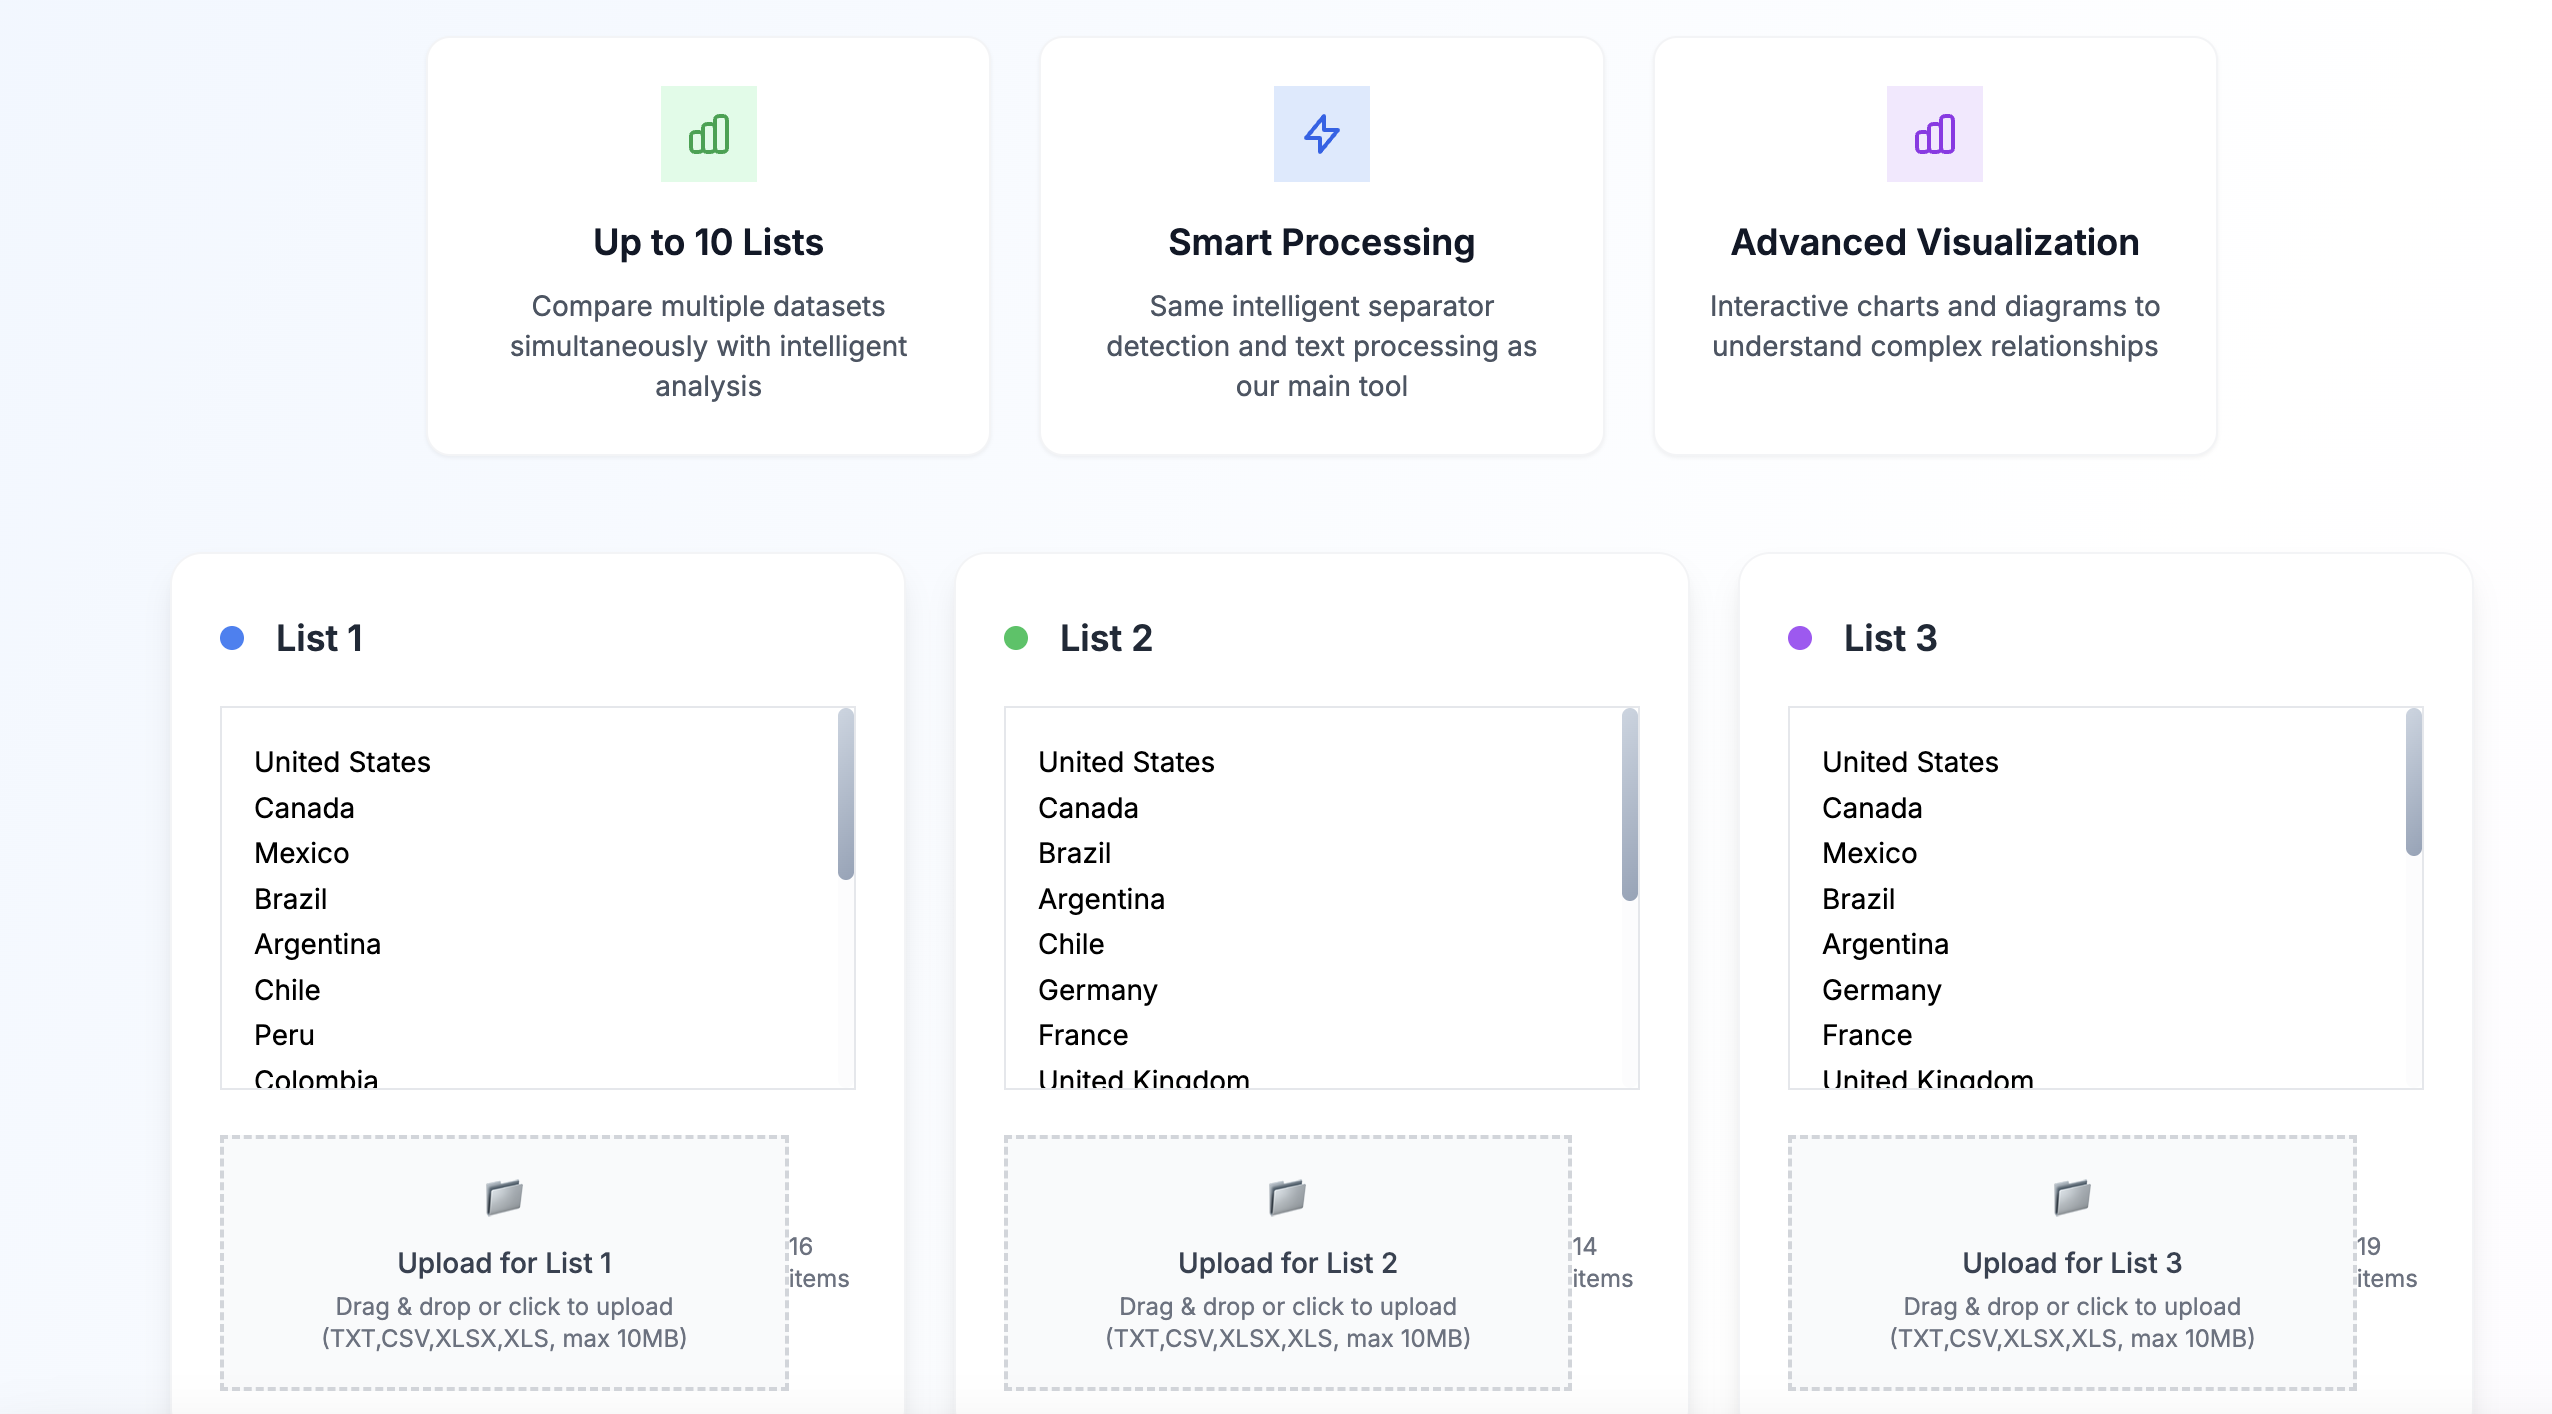
Step 1: Add Your Lists
Start with three lists (our minimum for meaningful multi-list comparison) and add up to ten. Each list gets a custom name and color, making it easy to track your data sources.
Step 2: Input Your Data
Type directly, paste from other applications, or upload files. Our system handles TXT, CSV, and Excel files up to 10MB each. The same smart processing that powers our main tool ensures accurate results regardless of your data format.
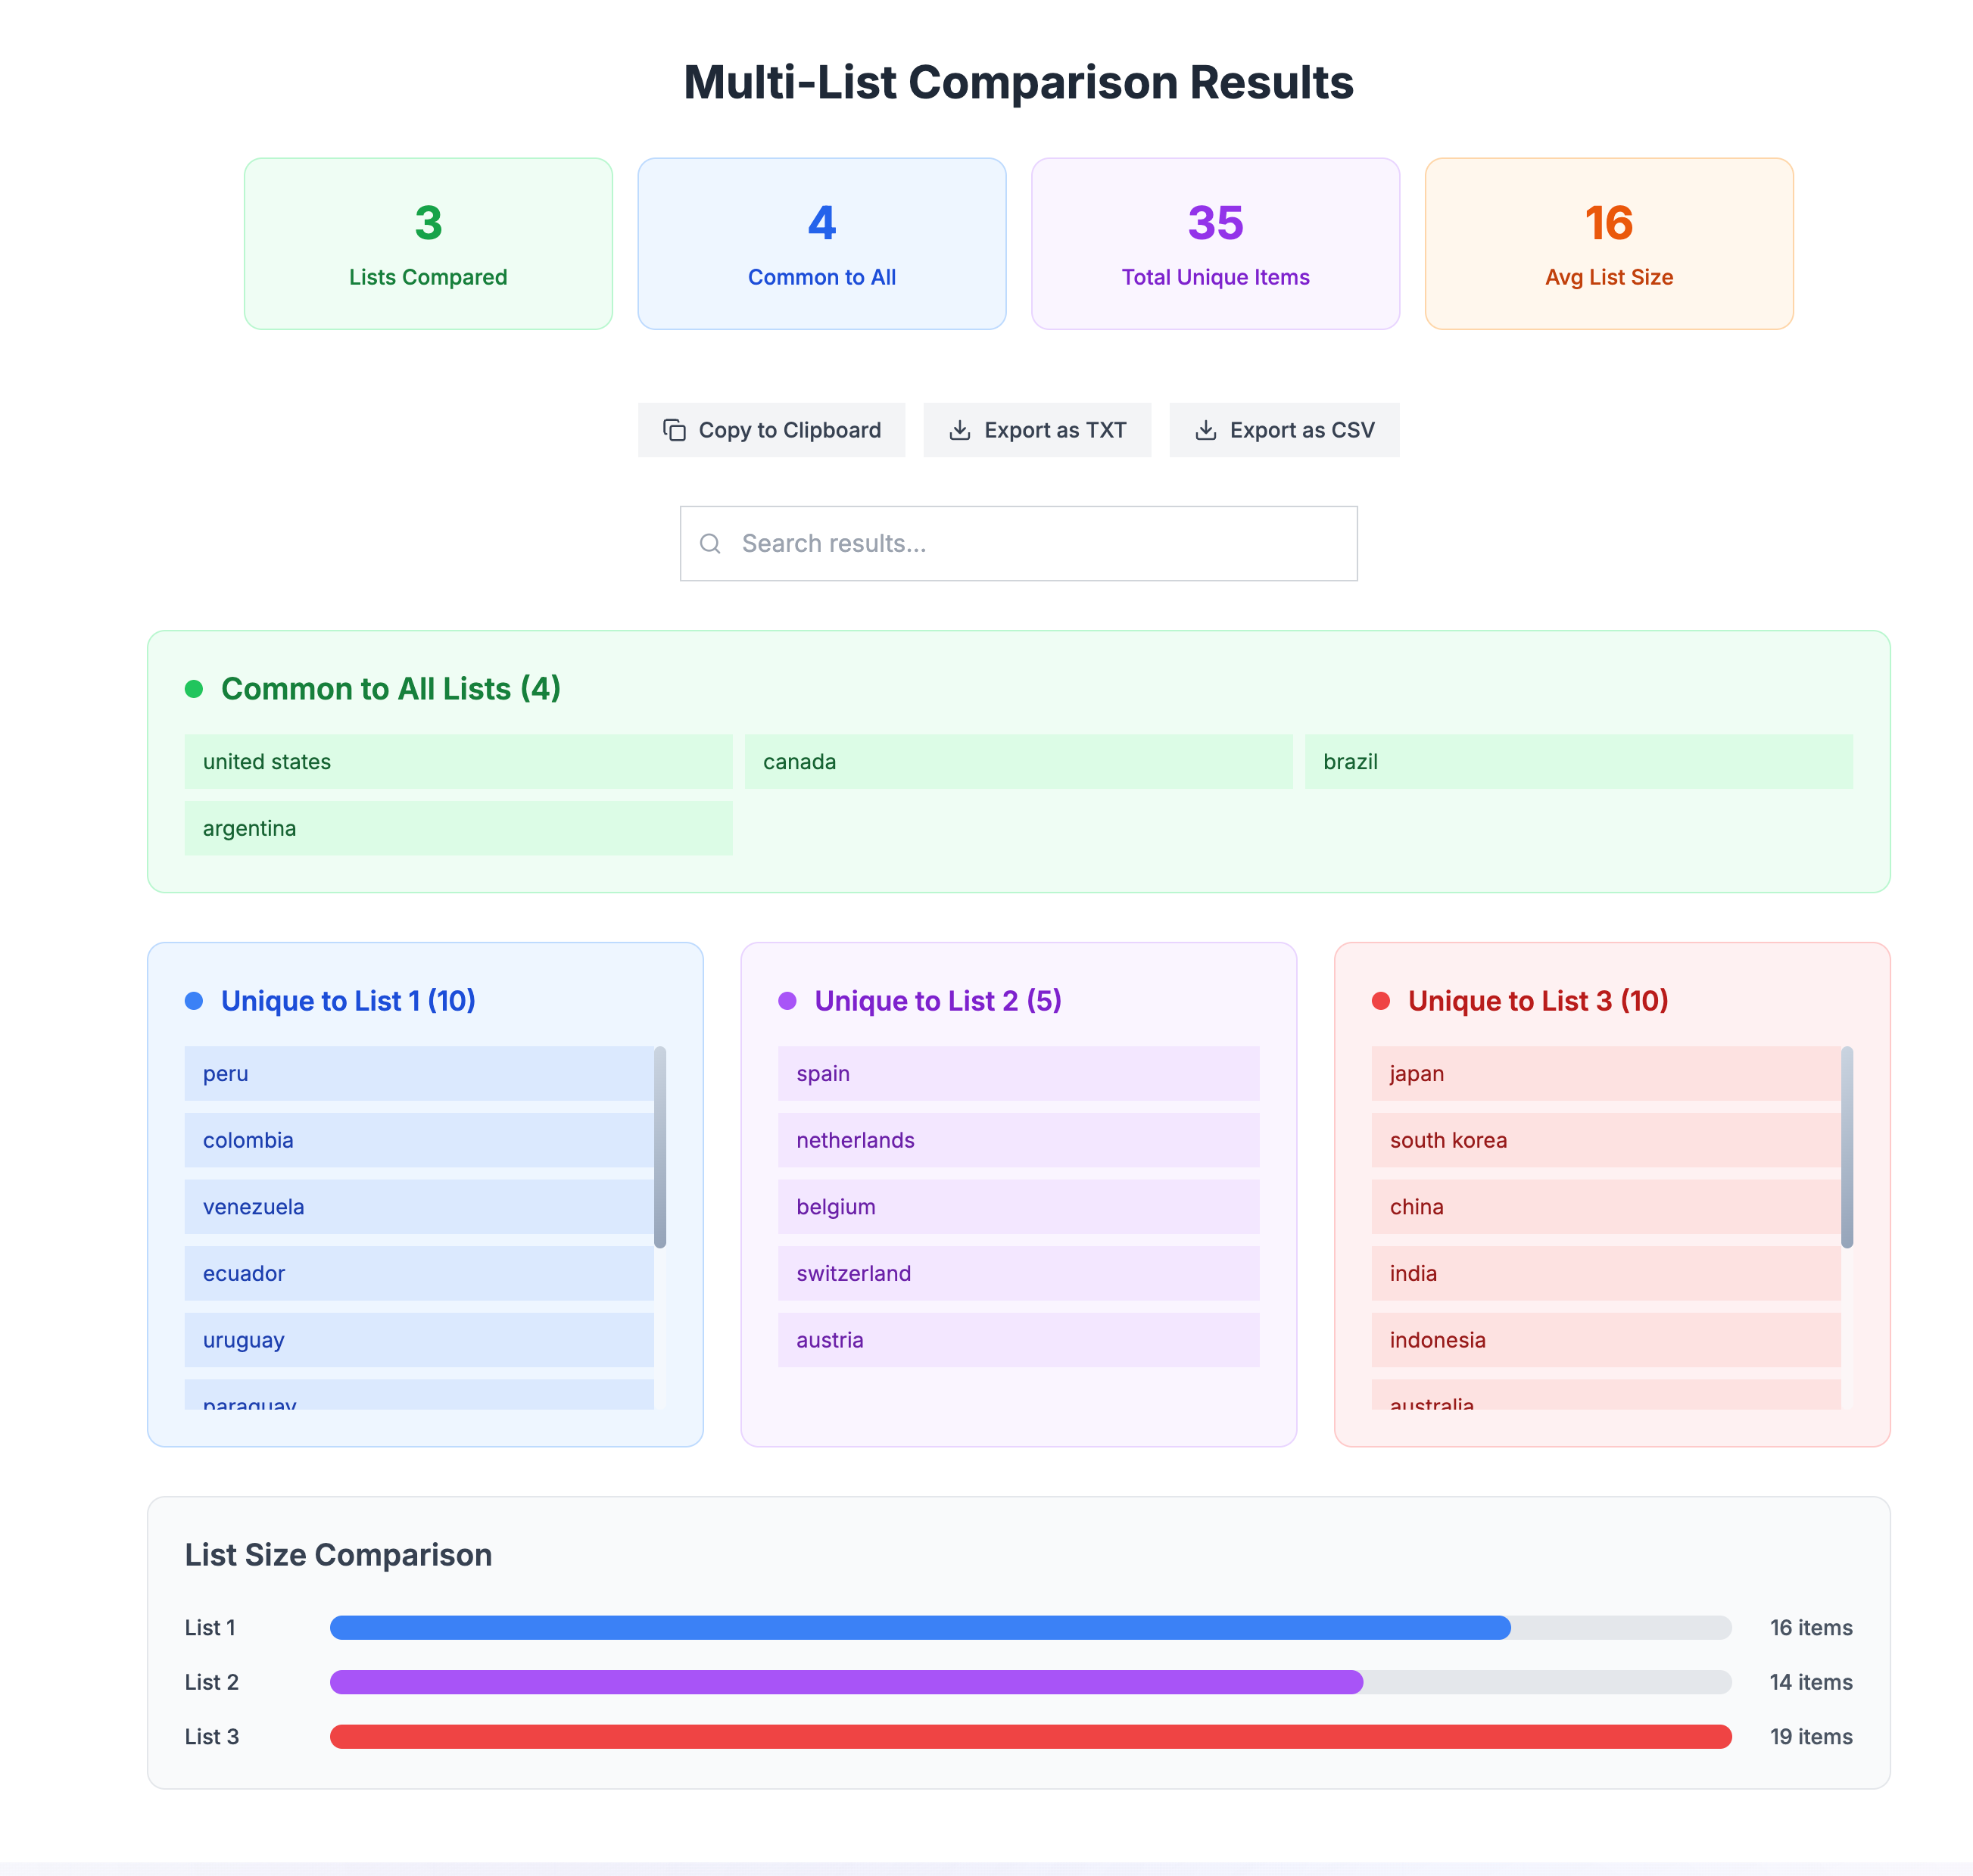
Step 3: Compare and Analyze
Hit the compare button and watch the magic happen. Within seconds, you'll see:
- Items common to all lists
- Items unique to each list
- Statistical breakdowns and similarity metrics
- Visual representations of your data relationships
Step 4: Export and Act
Export your results in CSV or TXT format, or copy them to your clipboard. The insights are yours to use however you need.
Advanced Features for Power Users
Flexible Settings
Use the same advanced settings from our main tool:
- Case sensitivity control
- Whitespace handling options
- Custom separator detection
- Fuzzy matching for similar items
Search and Filter
With potentially thousands of results across multiple categories, our search functionality helps you find specific items quickly. Looking for a particular customer across all your lists? Just type their name.
Statistical Insights
Beyond just showing you the differences, we provide meaningful statistics:
- Total unique items across all lists
- Average list size
- Overlap percentages between any two lists
- Similarity matrices for complex analysis
Why This Matters for Your Business
Save Time, Reduce Errors
Instead of managing multiple two-way comparisons and trying to synthesize the results manually, you get comprehensive analysis in one step. What used to take hours now takes minutes.
Discover Hidden Insights
Multi-list comparison reveals patterns that are invisible when you compare two lists at a time. These insights can drive better business decisions, more effective marketing campaigns, and more efficient operations.
Scale Your Analysis
Whether you're a solo entrepreneur or part of a large enterprise, our tool scales with your needs. Compare lists for small projects or analyze massive datasets—the process remains simple and fast.
The Human Touch in Data Analysis
Here's what I've learned from building this tool: data analysis isn't just about numbers and algorithms. It's about helping real people solve real problems. Every feature we've built comes from listening to users like my marketing friend, like Sarah the boutique owner, like the countless professionals who've shared their challenges with us.
When you compare lists using our tool, you're not just processing data—you're uncovering stories, finding opportunities, and making connections that drive your business forward.
Looking Forward
This is just the beginning. We're already working on enhanced visualization options, collaboration features for teams, and even more intelligent analysis capabilities. But for now, we're excited to see how you'll use multi-list comparison to transform your own data analysis workflows.
Ready to Transform Your Data Analysis?
Whether you're managing social media campaigns, analyzing customer segments, comparing supplier catalogs, or diving into any other multi-dataset challenge, our multi-list comparison tool is ready to help.
The best part? It's available right now, with the same privacy-first approach and user-friendly design that you love about our main comparison tool. No learning curve, no complicated setup—just powerful analysis at your fingertips.
Try Multi-List Comparison Now →
Have you tried our multi-list comparison tool? We'd love to hear about your use cases and experiences. Drop us a line at yzshi123@gmail.com—your feedback helps us build better tools for everyone.
Tags
Related Articles
Compare Instagram Follower Lists - Track Growth & Engagement
Discover how to effectively track Instagram followers and unfollowers using professional list comparison tools. Learn to compare two lists of followers, analyze engagement patterns, and optimize your social media strategy.
Visualizing List Comparisons: How to Unlock Powerful Data Insights
Discover how visual list comparison tools can transform your data analysis experience. Learn how our interactive visualizations help you quickly understand differences between lists and make better decisions.
Excel vs List Comparison Tools - Why Analysts Switch
A data analyst shares real experiences about abandoning Excel for list comparison tasks. Discover why smart comparison tools outperform traditional methods and save hours of manual work.